Just as a meteorologist uses a radar to predict weather, you can use website heatmaps to forecast your business’s online success. They’re not just colorful graphics. They’re powerful tools that reveal your visitors’ behavior. With heatmaps, you’ll understand, improve, and optimize your website. You’re not just designing a site. You’re creating an experience.
Explore how website heatmaps can significantly impact your business’s digital journey.
Enhancing the user experience
You’re determined to make your website more intuitive, engaging, and user-friendly. But how can you do this effectively? The answer lies in the strategic use of website heatmaps.
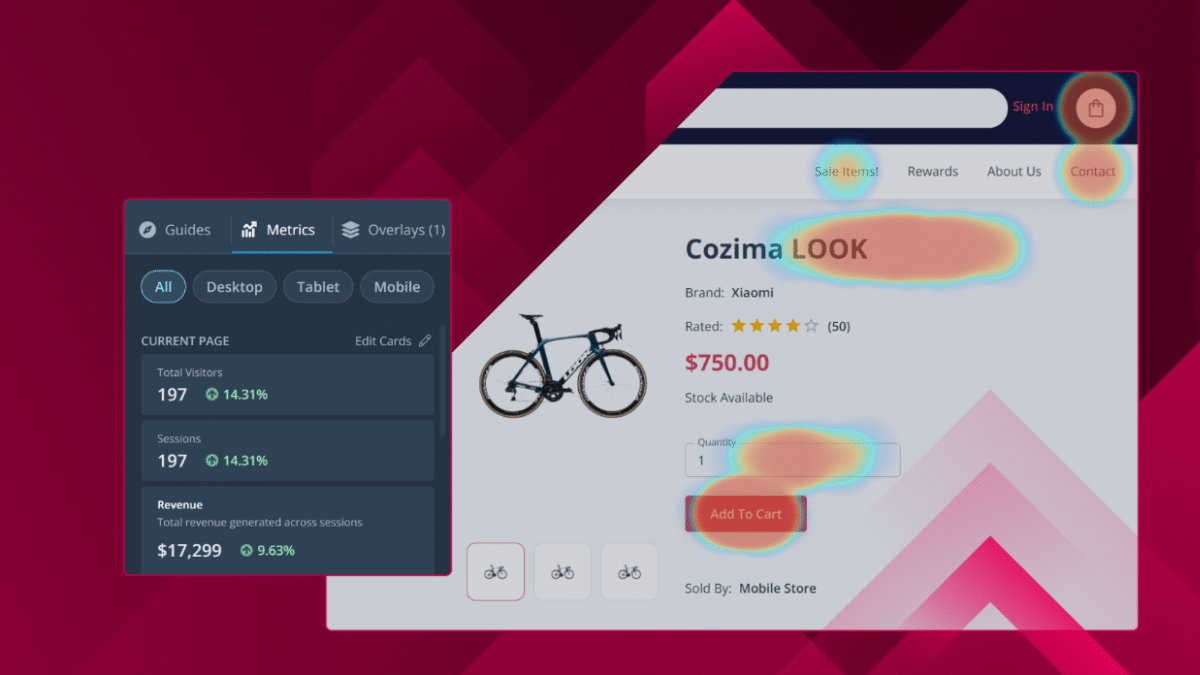
Website heatmaps are innovative tools that visually represent user behavior on your site. Heatmap creator tools show what areas of your site users interact with the most and least. The brighter or ‘hotter’ an area is on the heatmap, the more user interaction it gets. These tools can give detailed insight into your users’ behavior, helping you better understand their needs and preferences.
The benefits of website heatmaps include identifying usability issues on your site. If certain areas of your site are consistently ‘cold,’ it’s a strong indicator that users are having difficulty navigating or finding value in that section.
Improving website navigation
To significantly beef up your website’s user experience, you’ll have to drill down into your website heatmap data and figure out how to improve the user interface and website navigation.
Digging into your heatmap data, you might notice that some areas of web pages on your website are getting more attention than others. This feature could indicate that visitors find these sections more engaging or easier to navigate. Conversely, less-active areas might need a redesign or more compelling content to attract users.
Improving website navigation isn’t just about making your site look better. It’s about understanding your users’ needs and preferences and creating a seamless, intuitive journey. For instance, if your heatmap tools show a lot of activity on your search bar, your visitors have trouble finding what they need.
Understanding user engagement
A heat map shows you where users interact with your site the most. The hotter the area, the more user engagement you have, and the colder regions indicate less interaction with desktop users.
A strategic heatmap analysis can reveal a wealth of information. For instance, you might discover from the click maps that users spend more time on your blog page than your product page or click on non-clickable elements. This data-driven insight allows you to make the necessary adjustments to improve user engagement.
The benefits of using heatmaps for analyzing user engagement are manifold. They provide a clear and immediate picture of what’s working and what’s not on your site. Understanding and leveraging user engagement through heatmap data analysis is an effective way to ensure your site’s success.
Optimizing call-to-actions
You must craft a compelling call-to-action (CTA) to optimize your website to drive user engagement and conversions. But how can you achieve this? The answer lies in the meticulous analysis of mouse tracking of user interactions and customer behavior through data visualization tools like website heat maps.
You can see where your users click, how far they’re scrolling, and what they ignore. By analyzing the website heat map, you can identify which CTAs are working and which aren’t. You’ll see where users are instinctively drawn to your page, which can guide you in strategically placing your CTAs.
It’s not just about placing a button and hoping it works. It’s about understanding your users’ behavior, habits, and preferences. The more data points you have, the more your decisions will improve.
Identifying conversion opportunities
Identifying conversion opportunities isn’t just about spotting the gaps. It’s about using the right tools to do the job. Website heatmaps, for instance, are a potent weapon in your arsenal.
You’re probably thinking, ‘Great, but how do heat mapping tools help me?’ Here’s how: You can optimize these zones to increase conversions by identifying areas with high customer engagement. For instance, if a section on your homepage gets much attention but isn’t converting, it’s time to tweak the call-to-action or adjust the layout.
Conversely, areas with low engagement may need a rethink. After all, there’s no point in wasting web content that isn’t viewed. So, don’t just settle for three out of five conversion opportunities. Use the right tools, understand your users better, and seize all five.
Streamlining content placement
Heatmaps aren’t just colorful overlays but powerful tools for streamlining your content placement. They tell you exactly where users focus when clicking and scrolling a web page. They can show you if users are missing critical elements because they’re placed too low on a page or ignoring areas overloaded with information.
Streamlining your content placement based on this data can lead to remarkable improvements in your site’s performance. So, don’t underestimate the power of website heatmaps. They’re a roadmap to a more effective, user-friendly site.
Enhancing mobile responsiveness
While optimizing your website’s desktop version using heatmaps, remember that enhancing mobile responsiveness is crucial because more people are browsing on their smartphones now than ever.
The insights you gain from mobile heatmaps can help you identify which mobile elements are getting the most engagement and which are being ignored. For instance, you might discover that certain interactive elements on your mobile site distract users from your page’s main links or call to action.
Mobile heatmaps can help you understand whether your site’s layout and design are mobile-friendly. If users have to zoom in to read text, scroll maps, or click on links, it’s a sign you need to improve your site’s mobile responsiveness.
Tracking performance metrics
As you dive deeper into tracking performance metrics, remember that they’re not simply about numbers but about understanding your audience’s behavior and adapting accordingly.
You can build a more comprehensive understanding of your audience by utilizing website heatmaps alongside other analytics tools and tracking performance metrics. You’ll notice patterns, discover pain points, and, crucially, you’ll be able to respond to these discoveries with actionable changes.
Remember, however, that website heatmaps aren’t a standalone solution but rather a supplement to your existing suite of analytics tools.
Last Words
You’re leveling up your business by harnessing the power of website heatmaps. You’re enhancing the user experience, optimizing CTAs, and identifying hot conversion opportunities. Plus, you’re making strides in mobile responsiveness and performance tracking. So, dive in and let heatmaps guide your website’s evolution. The data awaits!